Value in the Canadian Dollar
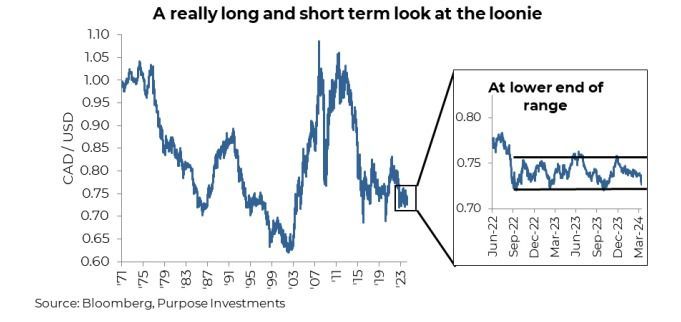
The CAD vs USD exchange rate has certainly been on the move over the past few months, to the detriment of the loonie. After rising into year-end to finish 2023 at about 75 ½ cents, the CAD has fallen down close to 72 ½ cents. The CAD is trading near the lower end of its recent range. Ah, remember the days when the loonie was on par with the U.S. dollar? Disney trips felt cheap, cross-border shopping was all the rage, and oil carried an average price of $96/bbl. Huh, with oil moving from the $70s to the high $80s, that sure doesn't match a 72 ½ cent loonie. Are we no longer a petrol currency? Maybe a decade of underinvestment and uncertainty around takeaway infrastructure can change a currency's stripes. Or there are other factors that are bigger than the oil impact on our currency exchange with the almighty dollar.
The weakness in the Canadian dollar is pretty easy to explain. U.S. inflation has ticked higher, as has the American economic data. Meanwhile, in Canada, the opposite trend is apparent. Just look at the Citigroup economic surprise indices for each country. This rolling index measures economic data releases relative to consensus forecasts, weighted based on the importance of each data release. Canada has averaged about -36, while the U.S. has been +40 so far in 2024. Not surprisingly, this has translated into a widening spread of 2-year yields, the tenor of yields most impactful on spot currency exchange rates. U.S. 2-year yields are 4.89% compared to 4.17% in Canada, roughly the widest spread over the past decade. This has also translated into expected central bank rate cuts. In January, the market consensus was pricing in a whopping seven cuts (25bps each) for the U.S. Fed Funds rate, while Canada was forecast to cut five times. Fast forward to today, they are tied at 2 ½ cuts each.

Yet flying in the face of a weaker CAD is commodity prices. While perhaps not as strong as it was historically, the CAD dollar usually does well when commodity prices are rising, and global economic growth is improving. That is clearly not the case of late, and I would even argue this is a material disconnect. The chart below is the CRB commodity index and the price of oil compared to the CAD/USD. Normally, there is a pretty decent correlation between these factors, but not lately.

One important consideration is that the recent currency move in the loonie is more about USD strength than CAD weakness. While the CAD has lost about 5% against the USD so far this year, it has been relatively flat against other major currencies, such as the yen and euro. This really points to USD strength due to higher inflation, tempering of rate cuts, and better relative economic growth data.
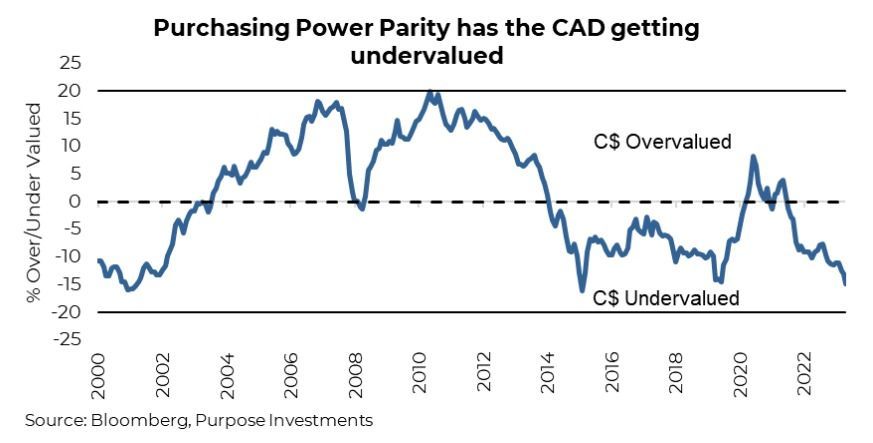
But at 72 ½ cents, is there value in the loonie? It is starting to look that way. There is no denying the CAD is undervalued, as highlighted in the purchasing power parity chart below. This doesn’t mean it will fix this undervaluation anytime soon; there are fast drivers of currencies (most of the previously mentioned factors), and then there are slow drivers. Valuation is a slow driver, as are deficits. Sure, everyone runs deficits; that isn’t anything new. But the U.S. has taken deficits to new levels outside a recession/war/pandemic environment. At some point, that will be a negative for the USD relative to more fiscally responsible national currencies. We’re not saying Canada is fiscally responsible, but it is on a relative basis compared to the U.S.
Final Thoughts
Currency exposure is an important component of managing multi-asset portfolios. We remain largely unhedged with our USD exposures, which has been the right call. Generally, we like being unhedged, as the USD can be a powerful diversification tool for Canadian portfolios. However, our conviction on this is waning; the further the CAD depreciates, the better the risk-return trade-off for hedging. We're not there yet, but it is starting to look rather interesting.
— Craig Basinger is the Chief Market Strategist at Purpose Investments
Disclaimers
Source: Charts are sourced to Bloomberg L.P. and Purpose Investments Inc.
The contents of this publication were researched, written and produced by Purpose Investments Inc. and are used by Echelon Wealth Partners Inc. for information purposes only.
This report is is authored by Craig Basinger, Greg Taylor and Derek Benedet Purpose Investments Inc.
Insurance products and services are offered by life insurance licensed advisors through Chevron Wealth Preservation Inc., a wholly owned subsidiary of Echelon Wealth Partners Inc. This material is provided for general information and is not to be construed as an offer or solicitation for the sale or purchase of life insurance products or securities mentioned herein. Every effort has been made to compile this material from reliable sources however no warranty can be made as to its accuracy or completeness. Before acting on any of the above, please seek individual financial advice based on your personal circumstances. Please note that only Echelon Wealth Partners is a member of CIPF and regulated by IIROC; Chevron Wealth Preservation is not.
Forward-looking statements are based on current expectations, estimates, forecasts and projections based on beliefs and assumptions made by author. These statements involve risks and uncertainties and are not guarantees of future performance or results and no assurance can be given that these estimates and expectations will prove to have been correct, and actual outcomes and results may differ materially from what is expressed, implied or projected in such forward-looking statements.
The opinions expressed in this report are the opinions of the author and readers should not assume they reflect the opinions or recommendations of Echelon Wealth Partners Inc. or its affiliates. Assumptions, opinions and estimates constitute the author’s judgment as of the date of this material and are subject to change without notice. We do not warrant the completeness or accuracy of this material, and it should not be relied upon as such. Before acting on any recommendation, you should consider whether it is suitable for your particular circumstances and, if necessary, seek professional advice. Past performance is not indicative of future results. These estimates and expectations involve risks and uncertainties and are not guarantees of future performance or results and no assurance can be given that these estimates and expectations will prove to have been correct, and actual outcomes and results may differ materially from what is expressed, implied or projected in such forward-looking statements. Echelon Wealth Partners Inc. is a member of the Investment Industry Regulatory Organization of Canada and the Canadian Investor Protection Fund.
Share This Post


Call our office today for a private consultation about your Beyond Wealth needs.

Team Lairar
1565 Carling Avenue
Suite 600
Ottawa, Ontario
K1Z 8R1
LINKS
JOIN OUR MONTHLY NEWSLETTER
Contact Us


Please note that only Echelon Wealth Partners is a member of CIPF and regulated by IIROC; Chevron Wealth Preservation Inc. is not. *Insurance Products provided through Chevron Preservation Inc.