Energy Stars Align
The oil market has been interesting lately and, to the surprise of many, has been the biggest silent outperformer this year. There is no shortage of geopolitical events to choose from that’s leading to a higher risk premium in oil with Brent breaking $90, whether it’s the Houthis missile attacks in the Red Sea leading to a massive re-route of trade, Ukraine’s drone strikes on Russian refineries, and the latest escalation between Israel and Iran leading to some news outlets using WWIII as click bait-y headlines. Given the run-up in oil prices, Canadian oil equities have clearly benefitted from the much higher torque. But there is a layer of even better news: The Transmountain Expansion (TMX) continues to look to be in operation by May, which would lead to much better pricing on the Western Canadian Select (WCS). With the current setup for the oil markets, some key questions that we often get from investors are: How sustainable is the rally in Canadian energy names?
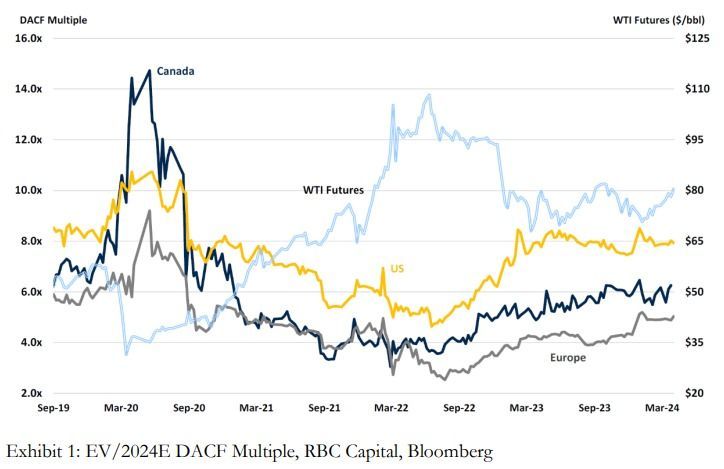
To determine if the oil equities are overstretched, we can look at the debt-adjusted cash flow (DACF) multiples of the major integrated oil names and see how the valuation has shifted in light of the recent oil move. From Exhibit 1, the DACF multiples for the Canadian integrated have been fairly range-bound over the last year, also in line with WTI, which has been in the $70 - $85 range. As a starting point, we can infer that the valuations of the companies have been commensurate with the movements in the underlying oil price deck and in line with where the equities should trade in the cycle historically over the last couple of years. Typically, in the commodities cycle, higher prices are usually coupled with lower multiples as market participants will usually price in lower normalized prices and vice versa, so a cause of concern would be if valuation starts trending towards the 6.5x – 7.0x+ area if oil prices continue to stay in the upper bounds of the $70 - $90 range or higher.
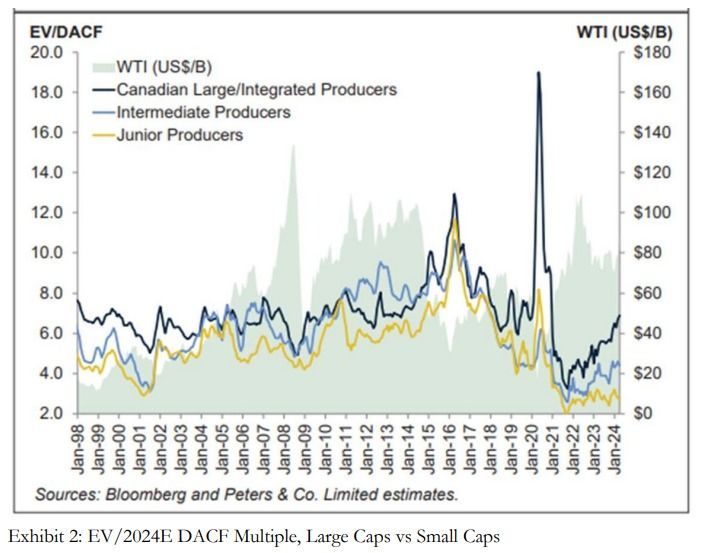
To gauge the broader valuation in the Canadian energy space further, we looked at the valuation of larger-cap integrated oils versus the intermediates and juniors. Interestingly, the valuation gap between the intermediate producers versus the large caps has widened since the 2021 lows. The valuation gap for junior producers is even more pronounced, with multiples virtually unchanged over the last few years, and the valuation spread to larger caps is the widest it has been in 25 years, excluding the COVID-19 years, as shown in Exhibit 2. We speculate the main reason for this valuation gap is due to many institutional investors divesting their oil & gas investments during COVID-19 in chasing clean energy/ESG names, so oil & gas specialists either were repurposed to other sectors or left the industry altogether.
Fast forward to 2022, when the energy crisis was already happening even before the Russian invasion of Ukraine, and now we’re seeing a rush from investors to get back into the space as it becomes harder to justify to your constituents why you’re underweight energy. Given the need to get back into the space quickly, we can see the path of least resistance from many funds to simply buy into more liquid, larger cap names to capture the beta. As the saying goes, no one gets fired for buying Microsoft. The same is probably now true for Canadian Natural Resources or Tourmaline in the energy space. The key takeaway is while we think larger cap oil equities will likely be steady as she goes, given the numerous tailwinds in macro, we think investors will get paid with asymmetric risk-reward if they do the work on some of the intermediate and junior names in the space.
Some have questioned whether the valuation gap between Canadian E&Ps and US E&Ps will tighten over time as we’ve seen a structural discount since pre-COVID. We certainly think there is a case to be made here given the impending commercial operation of the Transmountain Expansion pipeline, which will significantly increase the egress of Canadian oil, a pain point for many years that’s self-inflicted by Canadian politics. Improving egress means better pricing of WCS on the world stage, and lower volatility as a function of WTI price means investors will underwrite higher valuation multiples. Canada’s oil reserves, on a proven and probable basis, span decades. Sustaining capital expenditure to maintain an oil sands project is significantly lower than U.S. shale, where you’re on a constant treadmill to find new acreage and drill high-decline wells. Despite all this, we don’t think Canadian E&Ps should trade at parity to U.S. E&Ps. While TMX is certainly a positive, we take stock in the fact that the pipeline will likely be full by 2027 and we end up having to ship the marginal barrels via rail once again. We will certainly see a few optimization/compression-type projects along the way that improve capacity incrementally, but only time will tell whether we will get another huge step function in Canadian egress in the coming years. TMX project was first submitted to the regulators in 2013, so it’s been a long time coming, with the latest cost overrun estimate at $30B+, or ~$800 per capita.
Final Thoughts
The bottom line for those looking at the Canadian energy space is to invest for the right reasons, and those are 1) step function increase in production, 2) lower volatility from better-realized pricing of WCS, 3) attractive (but not firesale) valuations for steady returns, and 4) outsized opportunities in the intermediates and juniors. Betting on the direction of oil, in our view, is not amongst the top reasons to invest in Canadian energy names, and we would rather focus on a sustainable approach where we pick producers that can generate outsized returns on a full-cycle basis at reasonable valuations.
— Jeremy Lin, CFA is a Portfolio Manager at Purpose Investments
Disclaimers
Source: Charts are sourced to Bloomberg L.P. and Purpose Investments Inc.
The contents of this publication were researched, written and produced by Purpose Investments Inc. and are used by Echelon Wealth Partners Inc. for information purposes only.
This report is is authored by Craig Basinger, Chief Market Strategist, Purpose Investments Inc.
Insurance products and services are offered by life insurance licensed advisors through Chevron Wealth Preservation Inc., a wholly owned subsidiary of Echelon Wealth Partners Inc. This material is provided for general information and is not to be construed as an offer or solicitation for the sale or purchase of life insurance products or securities mentioned herein. Every effort has been made to compile this material from reliable sources however no warranty can be made as to its accuracy or completeness. Before acting on any of the above, please seek individual financial advice based on your personal circumstances. Please note that only Echelon Wealth Partners is a member of CIPF and regulated by IIROC; Chevron Wealth Preservation is not.
Forward-looking statements are based on current expectations, estimates, forecasts and projections based on beliefs and assumptions made by author. These statements involve risks and uncertainties and are not guarantees of future performance or results and no assurance can be given that these estimates and expectations will prove to have been correct, and actual outcomes and results may differ materially from what is expressed, implied or projected in such forward-looking statements.
The opinions expressed in this report are the opinions of the author and readers should not assume they reflect the opinions or recommendations of Echelon Wealth Partners Inc. or its affiliates. Assumptions, opinions and estimates constitute the author’s judgment as of the date of this material and are subject to change without notice. We do not warrant the completeness or accuracy of this material, and it should not be relied upon as such. Before acting on any recommendation, you should consider whether it is suitable for your particular circumstances and, if necessary, seek professional advice. Past performance is not indicative of future results. These estimates and expectations involve risks and uncertainties and are not guarantees of future performance or results and no assurance can be given that these estimates and expectations will prove to have been correct, and actual outcomes and results may differ materially from what is expressed, implied or projected in such forward-looking statements. Echelon Wealth Partners Inc. is a member of the Investment Industry Regulatory Organization of Canada and the Canadian Investor Protection Fund.
Share This Post


Call our office today for a private consultation about your Beyond Wealth needs.

Team Lairar
1565 Carling Avenue
Suite 600
Ottawa, Ontario
K1Z 8R1
LINKS
JOIN OUR MONTHLY NEWSLETTER
Contact Us


Please note that only Echelon Wealth Partners is a member of CIPF and regulated by IIROC; Chevron Wealth Preservation Inc. is not. *Insurance Products provided through Chevron Preservation Inc.