Dividend Depression
Dividend investing is supposed to be easy. Find quality companies with long track records of paying or even increasing their dividends, buy some shares, collect your regular tax-advantaged payments over time and watch the share price go higher. Maybe in a strong bull market, dividend companies don’t rise as much, but they have better stability in down markets as most are lower beta than the overall market. Well, over the past year, the TSX has been up about 13% while the Dow Jones Canada Select Dividend Index (a good proxy for dividend investing) has been up 3%. Trailing in an upmarket is fine, but not by that much.
The DJ Select Dividend Index was created in the late 1990s and this is only the fifth time that it has lagged the broader TSX by more than 10% on a trailing one-year basis. Interestingly, most of the previous occurrences coincided with brief periods when a non-bank became the largest weight in the TSX. In the late 90s, it was Nortel; in 2007, it was Encana, Potash, and Blackberry. The 10% threshold was almost reached in 2015 when Valeant became the biggest company in the TSX. And in 2019, it was Shopify.
This makes this recent bout of underperformance of dividends vs the broader TSX rather unique, as the biggest stocks in the TSX remain dividend payers, including Royal Bank and TD Bank. Plus, the banks have been doing ok. It is other dividend payers that have dropped considerably that are dragging down the dividend space. Communication Services (aka Telcos) are down 24% over the past year, and Utilities are down 15%, two areas that are fertile with dividend-paying companies.
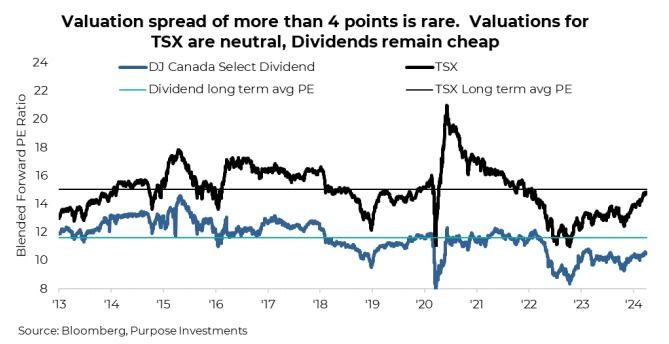
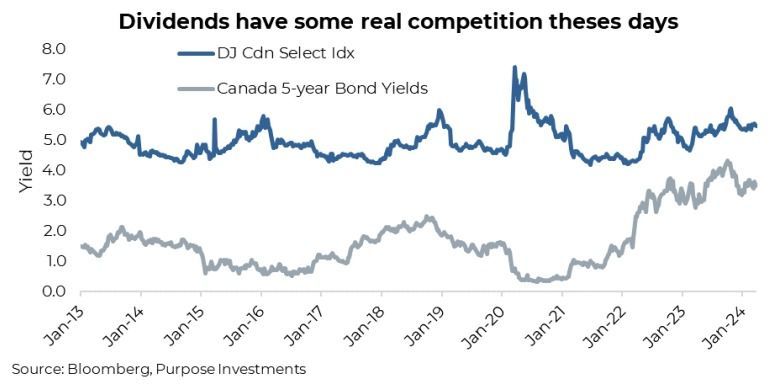
This has the valuations in the overall dividend space at roughly 10.5x forward earnings estimates, while the broader TSX is closer to 15x. That is an historically widespread. It was wider in 2020, but that is because the TSX’s earnings almost went to zero during a pandemic; it was not because of a higher index price. While dividends may be cheap vs the TSX, the real crux of the weakness stems more from relative yields. Bond yields moved higher in 2022 and have been maintaining at historically high levels compared to the past decade. This is a clear competitive investment for those looking for yield.
One could even argue that dividend yields need to increase more to remain competitive against yields available in the bond market. This isn’t an apples-to-apples comparison. Bonds benefit from greater stability as a true risk-off asset class. Dividends benefit from a history of growing the dividend rate over time and some rather appealing tax treatment. Plus, the stock price could go higher while bonds mature at 100. However, dividends can also be cut, and companies can even go bankrupt. We will assume the five-year government of Canada bond has a low default risk.
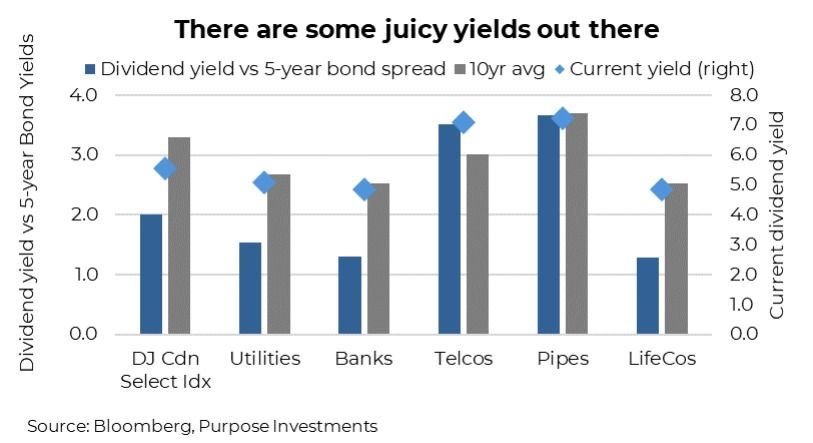
Yet, while the overall DJ Canadian Select Index dividend yield may not look overly enticing compared to bond yields (above chart), digging into specific sectors does show a different picture. The chart below shows the current dividend yield across various dividend-heavy sectors compared to the five-year government of Canada bond yields, plus the 10-year average spread and the nominal dividend yield. The overall dividend space may not be hugely enticing on a relative yield basis, but telcos and pipes sure are, each yielding about 7%.
Final Thoughts
The dividend space has clearly become rather challenging over the past year, given higher bond yields. But it isn’t just bond yields. The increased popularity of other sources of yield has certainly risen over the past number of years, from the structured notes space to covered call strategies that are being applied to just about anything with a live option chain. The search for yield has never had so many choices. So what could turn this tide and help the performance of dividend payers close that gap with the broader market? We’re not sure; maybe a broad market sell-off that cools the more aggressive risk-on behaviour. Maybe central bank rate cuts or lower bond yields. Or maybe just the realization that buying operating companies with decently safe dividends in the 5-7% range and attractive valuations offers a good risk/reward combination and a decent income stream as you wait out this dividend depression.
— Craig Basinger is the Chief Market Strategist at Purpose Investments
Disclaimers
Source: Charts are sourced to Bloomberg L.P. and Purpose Investments Inc.
The contents of this publication were researched, written and produced by Purpose Investments Inc. and are used by Echelon Wealth Partners Inc. for information purposes only.
This report is is authored by Craig Basinger, Greg Taylor and Derek Benedet Purpose Investments Inc.
Insurance products and services are offered by life insurance licensed advisors through Chevron Wealth Preservation Inc., a wholly owned subsidiary of Echelon Wealth Partners Inc. This material is provided for general information and is not to be construed as an offer or solicitation for the sale or purchase of life insurance products or securities mentioned herein. Every effort has been made to compile this material from reliable sources however no warranty can be made as to its accuracy or completeness. Before acting on any of the above, please seek individual financial advice based on your personal circumstances. Please note that only Echelon Wealth Partners is a member of CIPF and regulated by IIROC; Chevron Wealth Preservation is not.
Forward-looking statements are based on current expectations, estimates, forecasts and projections based on beliefs and assumptions made by author. These statements involve risks and uncertainties and are not guarantees of future performance or results and no assurance can be given that these estimates and expectations will prove to have been correct, and actual outcomes and results may differ materially from what is expressed, implied or projected in such forward-looking statements.
The opinions expressed in this report are the opinions of the author and readers should not assume they reflect the opinions or recommendations of Echelon Wealth Partners Inc. or its affiliates. Assumptions, opinions and estimates constitute the author’s judgment as of the date of this material and are subject to change without notice. We do not warrant the completeness or accuracy of this material, and it should not be relied upon as such. Before acting on any recommendation, you should consider whether it is suitable for your particular circumstances and, if necessary, seek professional advice. Past performance is not indicative of future results. These estimates and expectations involve risks and uncertainties and are not guarantees of future performance or results and no assurance can be given that these estimates and expectations will prove to have been correct, and actual outcomes and results may differ materially from what is expressed, implied or projected in such forward-looking statements. Echelon Wealth Partners Inc. is a member of the Investment Industry Regulatory Organization of Canada and the Canadian Investor Protection Fund.
Share This Post


Call our office today for a private consultation about your Beyond Wealth needs.

Team Lairar
1565 Carling Avenue
Suite 600
Ottawa, Ontario
K1Z 8R1
LINKS
JOIN OUR MONTHLY NEWSLETTER
Contact Us


Please note that only Echelon Wealth Partners is a member of CIPF and regulated by IIROC; Chevron Wealth Preservation Inc. is not. *Insurance Products provided through Chevron Preservation Inc.